
What MoMA’s New Exhibit Teaches Brands About Data Storytelling
MoMA’s Full Disclosure shows why people share data visualisations. The lesson for brands: infographics are identity signals, not just facts.
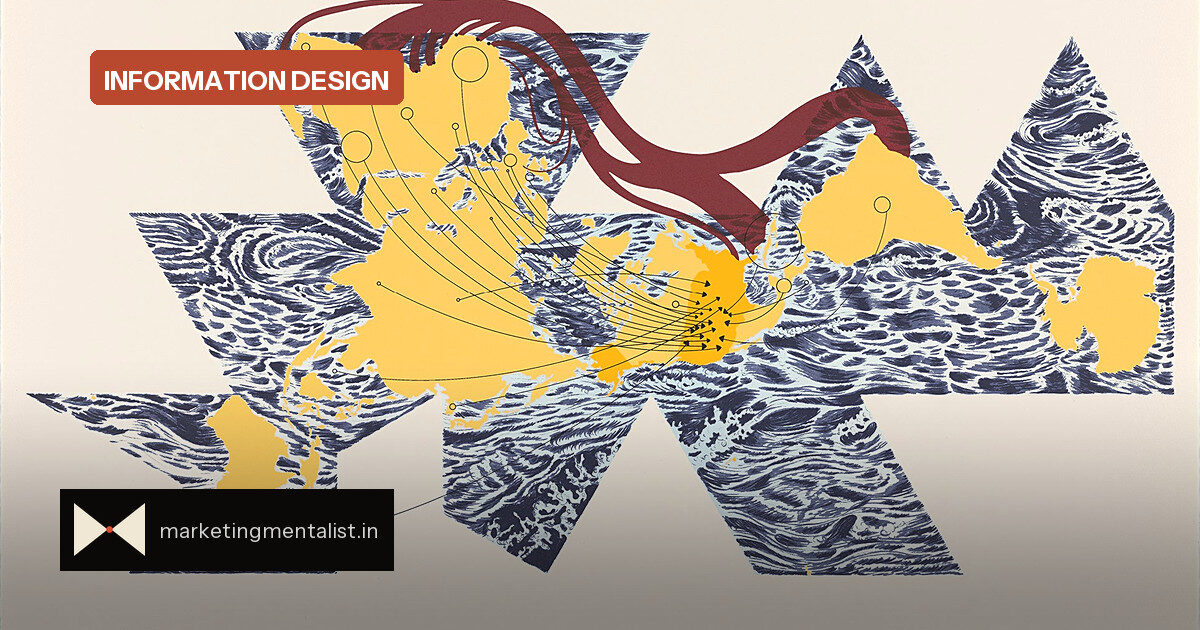
Most marketers still treat infographics as content—a tidy way to package facts. MoMA’s new exhibition, Full Disclosure: The Edge of Information Design, suggests something bigger. When people share a chart or a data visual, they are not only informing followers. They are signalling taste, values and the kind of person they want to be.
The show, which opens September 27, includes Warming Stripes by climate scientist Ed Hawkins as its first piece. The work turns yearly average temperatures into vertical stripes, moving from deep blue to bright red. It reads like a woven rug and hits like a warning. That tension—usefulness and beauty—runs through the whole exhibition.
Senior curator Paola Antonelli describes information design as a field that renders complex phenomena “comprehensible by a wide audience.” The point is not simplification for its own sake. It is translation: converting complexity into a visual language people can read fast.
Data as a badge, not just a brief
For brand managers, the useful insight is identity. A shareable infographic has two jobs. It must make the data legible. And it must make the sharer look thoughtful, conscientious or in-the-know. The exhibition makes this explicit: the Dear Data project by Giorgia Lupi and Stefanie Posavec visualised personal details such as how often each artist cursed in a week. The data was trivial; the connection was not.
This is the same mechanism that drives branded content. People do not share your chart because they need to broadcast the number. They share it because it says something flattering about them.
What MoMA is really positioning
The show is also a branding statement by the museum. By collecting information design since 2008—beginning with Design and the Elastic Mind—MoMA signals that it stays close to the present. Antonelli frames the exhibition as proof that the museum is “always ready to understand what’s important to the world in that particular moment.” In brand terms, this is positioning: MoMA is not only a keeper of art objects but a reader of contemporary culture. All but one piece comes from MoMA’s own collection, which makes the message even sharper.
Three rules for data that travels
- Use one visual metaphor. Warming Stripes compresses decades of temperature data into a colour field you feel before you parse.
- Let personal data show a human. Dear Data works because the dataset is ordinary; the format makes it intimate.
- Design for the sharer. Ask whether the chart makes the person posting it look sharp—not just whether it is accurate.
What to do with this
Before publishing a data visual, run the identity test. If a customer shares it, what does it say about them? If the answer is nothing, the design may be clear but not contagious. The MoMA show is a reminder that beautiful information is not decoration. It is a positioning tool—for museums, for brands and for the people who pass the data on.
Source: Fast Company